
Geographic Coverage
A Great Britain index blends England, Scotland and Wales, while an English transactions database excludes Scotland, Wales and Northern Ireland. Regional evidence can also hide substantial local variation.
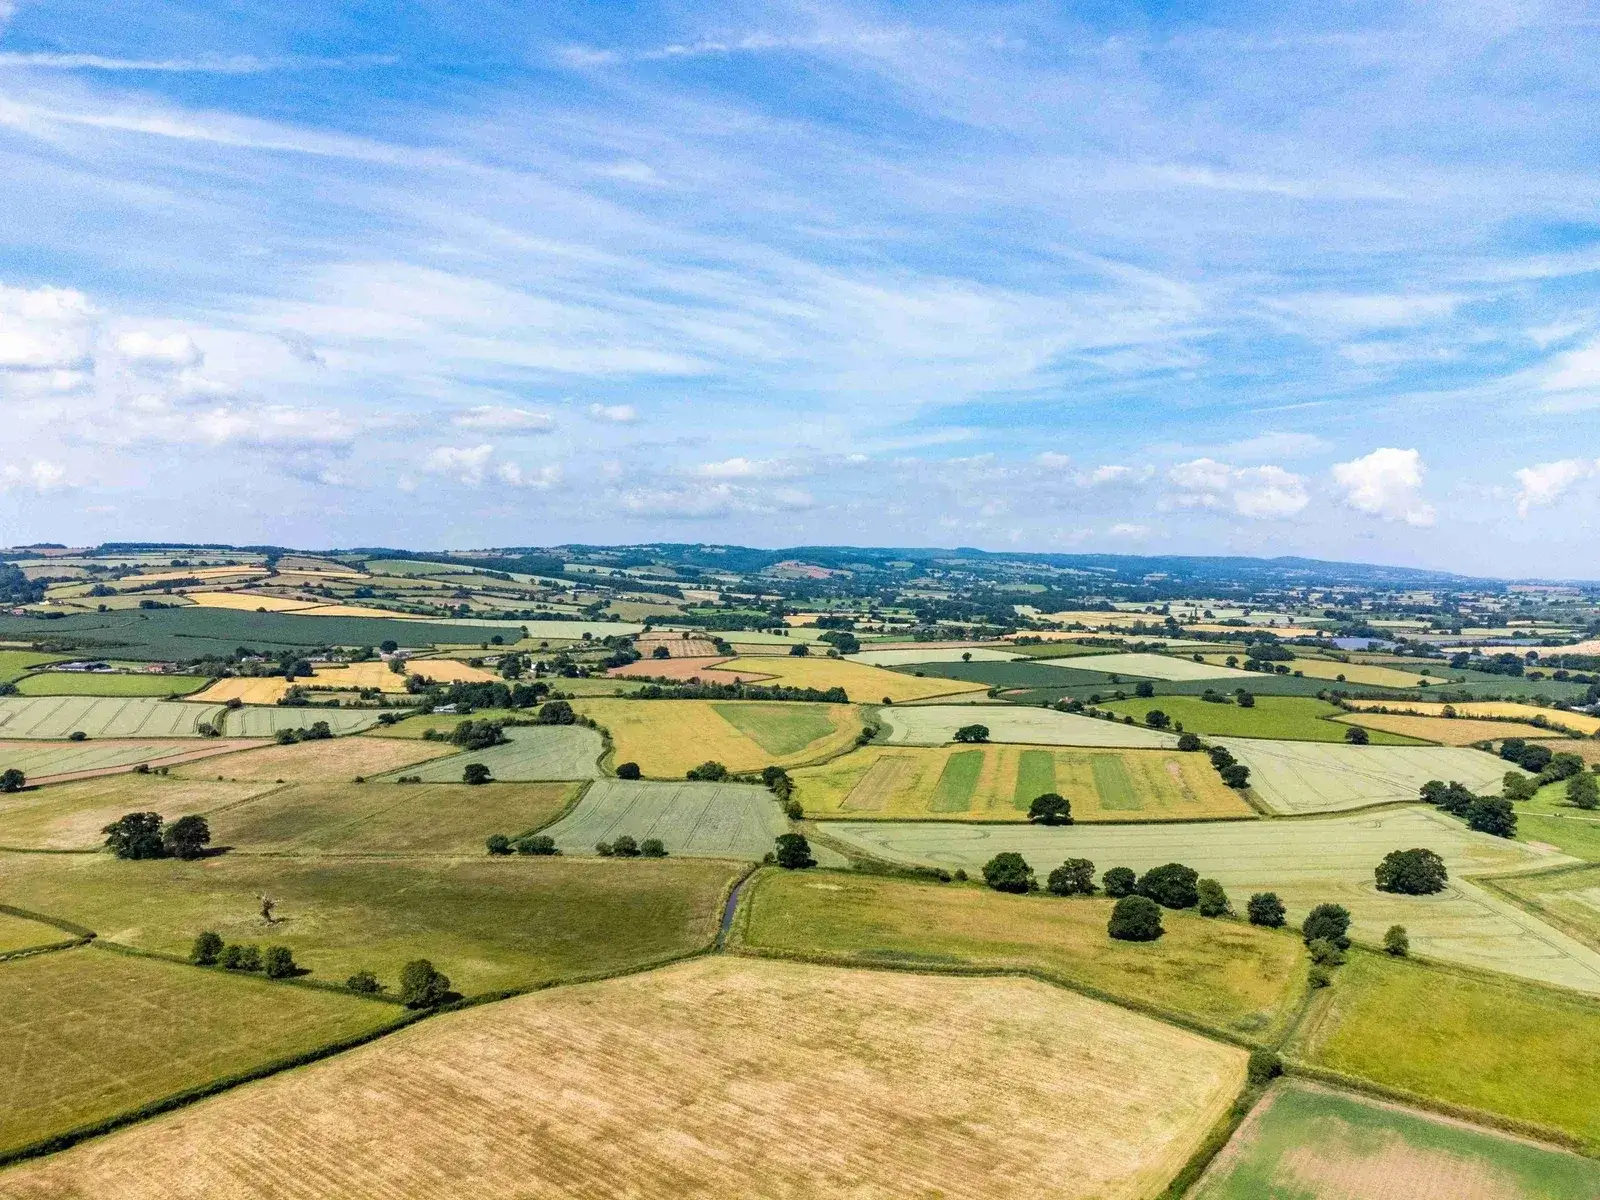
Agricultural land values varied widely throughout 2024 and 2025. Published averages differed because the main market surveys covered different regions, land types, lot sizes and evidence, ranging from broad professional indices to databases of larger completed or exchanged sales.
A national or regional rate can provide useful context, but it is not a valuation of a particular farm or field. Soil, drainage, access, occupation, buildings, lot size, local competition and special purchaser interest can move a holding materially above or below the reported average.
This page is a dated evidence guide. It records selected 2024 and 2025 indicators and explains how to interpret them. It should not be treated as a current 2026 price list, a formal Red Book valuation or evidence that agricultural land has residential development value.
At Value My Land, we consider the agricultural baseline separately from planning potential. Our free initial review can help identify whether a holding is likely to be valued principally for farming or whether location, policy or development factors warrant further investigation.
Send us the location to explore agricultural context and development potential
Market context reviewed 11 August 2026
The tables below remain a record of evidence reported for 2024 and 2025. They have not been relabelled as 2026 values. More recent market reporting indicates a selective market in which broad averages have softened or remained stable while the best-located and highest-quality farms can still attract firm competition.
Knight Frank reported an average bare-land value of £8,497 per acre for England and Wales in Q2 2026, down 1.5% over the quarter and just over 4% over twelve months. Strutt & Parker described Q1 2026 average prices as stable amid reduced supply and wide local variation. Carter Jonas reported that average values eased slightly in Q2 2026 while strong demand for the best opportunities continued to support prices.
These current indicators reinforce the central warning on this page: a national index is context, not a valuation. Recent nearby transactions, land quality, occupation, buildings, access, lot size and buyer competition remain essential.
A dated evidence guide, not a live price list
Published market figures help place a holding in context, but they cannot replace recent local comparable evidence and a site-specific valuation.
Agricultural land is frequently discussed as a price per acre, yet the apparent simplicity conceals wide variation. A 50-acre block of productive arable land, an equipped dairy farm, a tenanted grassland holding, a small paddock and land adjoining a settlement are different assets. Their buyer markets, income potential, possession, buildings, environmental features and future opportunities can produce very different prices.
This guide records selected published evidence from the 2024 and 2025 market. It is deliberately tied to those years. The figures are useful for understanding broad patterns and the scale of regional variation, but they should not be presented as a current 2026 valuation or as a guaranteed rate for a particular county, farm or field.
The most important caution is methodology. A survey of completed sales above 100 acres in England may report a higher arable average than an opinion-based index covering all grades across Great Britain. Neither figure is necessarily wrong. They describe different samples. Before quoting an average, the reader should ask which land was included, whether houses or buildings were excluded, when the evidence was recorded and whether the figure represents asking prices, exchanges, completions or professional opinion.
For a particular holding, the starting point remains its own characteristics: location, soil, drainage, field pattern, access, occupation, rights, buildings and local competition. Our Agricultural Land Value Guide explains these fundamentals in more detail.
Development potential should also be kept separate. Agricultural market evidence establishes an existing-use benchmark. A credible prospect of allocation, planning permission or another valuable use may create hope value, but that requires planning evidence and must not be inferred from a regional farmland table alone.
Use published averages to frame questions, not to answer the valuation. The correct comparable is land that is genuinely similar in location, quality, scale, occupation and sale conditions.
Different research methods produce different averages. Understanding the sample is essential before applying a figure.
A Great Britain index blends England, Scotland and Wales, while an English transactions database excludes Scotland, Wales and Northern Ireland. Regional evidence can also hide substantial local variation.
Some surveys analyse commercial farms or blocks above 50 or 100 acres. Others include a wider range. Larger holdings and small amenity parcels should not be treated as one market.
Bare-land figures generally exclude residential and equipped value. Whole-farm sales may include farmhouses, cottages, buildings, entitlements, woodland and income streams.
Indices may use valuer opinion, exchanged transactions, completed sales or marketed supply. Timing and confidentiality mean the recorded sample may differ from the market visible to an individual seller.
The figures below illustrate the range produced by different published methodologies rather than establishing one universal UK value.
| Evidence source and period | Reported indicator | Scope and interpretation |
|---|---|---|
| Strutt & Parker, England 2024 | £11,100 per acre arable and £9,000 pasture | An exchanged-sale series for English arable and pasture land. Houses and buildings were stripped out, but differences in quality and location mean the figures remain broad indicators. |
| Knight Frank, Q4 2024 | £9,164 per acre average bare agricultural land value | An opinion-based index tracking arable and pasture land across England and Wales using sales evidence, local market knowledge and professional sentiment. |
| Strutt & Parker, first nine months of 2025 | £10,400 per acre arable and £8,500 pasture | Based on farms and farmland parcels over 100 acres. It was an interim 2025 update rather than a complete calendar-year result. |
| Carter Jonas, Q4 2025 | £9,494 per acre arable and £7,778 pasture | Average England and Wales indicators at the end of 2025, with year-on-year falls of 2.3% for arable and 1.4% for pasture. |
| Knight Frank, Q4 2025 | £8,696 per acre average bare agricultural land value | The same opinion-based England and Wales series as the Q4 2024 entry, allowing a consistent comparison within that index. |
The figures are nominal market indicators for their stated periods. They should not be averaged together or applied mechanically to a holding.
The broad direction of the market
The available evidence points to a resilient but more selective market, with average movements masking large differences between holdings.
The 2024 market followed a period of exceptionally strong pricing in many areas. Larger English arable and pasture averages remained high, while broad Great Britain indices showed a more moderate overall rate. Supply increased in parts of the market, yet competition for well-located, productive or strategically attractive holdings remained capable of producing premium results.
During 2025, several published series recorded softer average values. Knight Frank’s consistent bare-land index moved from £9,164 per acre at Q4 2024 to £8,696 at Q4 2025. Strutt & Parker’s first-nine-months database reported £10,400 per acre for arable land and £8,500 for pasture, below its reported 2024 benchmarks. Carter Jonas ended 2025 at £9,494 for arable and £7,778 for pasture. These movements did not create a uniform decline: some farms remained strongly contested, while land with weaker quality, difficult access, investment requirements or unrealistic pricing took longer to sell.
Averages can also move because the mix of properties sold changes. A year containing more lower-quality pasture or fewer exceptional equipped farms can produce a lower mean even if like-for-like values are relatively stable. Conversely, a small number of premium transactions can lift a regional result.
The practical lesson is that market direction and individual value are related but not identical. Owners should examine the most recent nearby evidence and understand why buyers selected or rejected each comparable. The transaction date, lotting, possession, buildings and special purchaser interest matter as much as the headline rate.
Regional reviews provide useful context, but their scopes differed and the figures should be read as broad evidence rather than county-level valuations.
| Region | Indicative arable evidence | Indicative pasture evidence | Important qualification |
|---|---|---|---|
| East Midlands | Around £7,988 per acre | Around £7,317 per acre | Savills farmland supply database covering publicly advertised lowland farms and farmland of more than 50 acres. |
| West Midlands | Around £10,000 per acre | Around £8,500 per acre | Strutt & Parker opinion-based regional indicators excluding blocks of less than 100 acres. |
| South East | Around £10,200 per acre | Around £8,400 per acre | Savills farmland supply database covering publicly advertised lowland farms and farmland of more than 50 acres. |
| South West | Around £9,250 per acre | Around £7,750 per acre | Strutt & Parker opinion-based regional indicators excluding blocks smaller than 100 acres. |
| North East | Around £10,600 per acre | Around £8,000 per acre | Strutt & Parker opinion-based regional indicators excluding blocks of less than 100 acres. |
| North West | Around £8,324 per acre | Around £5,638 per acre | Savills farmland supply database covering publicly advertised lowland farms and farmland of more than 50 acres. |
| Yorkshire and the Humber | Around £10,400 per acre | Around £8,500 per acre | Strutt & Parker opinion-based regional indicators excluding blocks of less than 100 acres. |
Regional numbers drawn from different agents and minimum lot sizes are not a league table. They show why the evidence source and local sub-market must be identified.
Averages are not a valuation
We can review the location and planning context alongside the broad farmland position to identify whether a development or strategic-land issue warrants further investigation.
Request a Free Farmland and Planning ReviewThe United Kingdom does not operate as one uniform agricultural land market.
Scottish values vary strongly by productive district, altitude, enterprise and scale. Published 2025 evidence identified prime arable land in parts of East Lothian, Fife and Angus at approximately £10,000 to £15,000 per acre, while grazing and mixed land could be materially lower.
Welsh evidence is often dominated by grassland, dairy and livestock holdings, with quality, buildings, residential elements and local competition producing substantial variation. Some productive grassland examples have exceeded £10,000 per acre, but there is no sound basis for applying that rate nationally.
Different tenure, sporting, forestry, natural-capital and subsidy considerations may also influence the buyer market in Scotland and Wales.
Northern Ireland frequently records a higher agricultural price per acre than many Great Britain regions because supply is limited and demand can be intense. An annual survey of 157 transactions spanning more than 6,200 acres reported an average of £15,202 per acre for 2025, with substantial differences by county, quality and lot size.
That premium should not be transferred to English, Scottish or Welsh land. Market structure, farm size, local competition and scarcity are materially different.
For any UK jurisdiction, the correct evidence is recent, local and comparable evidence supported by inspection and an understanding of the rights, occupation and property included in the sale.
The price per acre is the result of the property and the buyer market, not a fixed regional tariff.
Soil, grade, rainfall, field condition, drainage and cropping performance affect productive capacity and long-term investment requirements.
Direct road access, internal tracks, gateways, field size and topography influence machinery use, livestock management and the practical efficiency of the holding.
Immediate control can widen the purchaser market. Tenancies, licences and occupation arrangements require legal review and may affect timing and price.
Farmhouses, cottages and buildings should be valued according to condition, planning use, restrictions, income and repair needs rather than absorbed into a bare-land rate.
Small amenity parcels may achieve a high rate per acre, while very large holdings require a deeper buyer pool. Sensible lotting can create or destroy competition.
Woodland, habitats, water, carbon, biodiversity and conservation opportunities may attract specialist buyers, but obligations and management costs must also be understood.
A neighbour, investor, rollover buyer or estate may pay more because the land has particular value to that purchaser. Such evidence may not represent general market value.
A credible future use can create hope value, but it should be supported by policy and technical evidence. See Hope Value Explained.
Scale changes the buyer market
The price per acre often rises as the total lot becomes affordable to non-farming buyers, but this is not a universal rule.
A two-acre paddock close to houses may appeal to equestrian, amenity, garden-extension or lifestyle buyers. The total purchase price may be manageable even when the implied price per acre is much higher than commercial farmland. Services, fencing, access and restrictive covenants can be particularly important in that market.
A 300-acre arable block is purchased for a different reason. Buyers will consider productive performance, operational fit, finance, location relative to an existing base and the capital tied up in a large acquisition. Applying the paddock rate across the whole block would normally be misleading.
Lotting can therefore affect receipts. Separating a farmhouse, buildings, amenity land and commercial land may widen competition, but it can also damage operational value, access, services or the appeal of the holding as a complete unit. Rights reserved between lots must be designed carefully.
The correct strategy depends on the seller’s objectives, tax and succession advice, retained land, timing and evidence of buyer demand. An agent should explain the rationale for the proposed lots and compare the likely net result after additional legal, marketing and infrastructure costs.
Do not mix the valuation layers
A regional farmland figure is an existing-use benchmark, not a substitute for a planning appraisal.
Agricultural value reflects the land as agricultural property, including its quality, occupation, improvements and market. It is the appropriate starting point where the highest and best use remains farming or another rural use. The general land valuation guide explains how comparable evidence is adjusted.
Hope value may arise where purchasers perceive a realistic prospect of a more valuable use in the future. It is not the full value of consented land. The market discounts for planning probability, time, promotion costs, obligations, technical risks and the buyer’s required return. A speculative rumour or nearby application does not automatically justify hope value.
Development value is normally tested through the proposed scheme, gross development value, build and infrastructure costs, planning obligations, finance, professional fees, abnormal costs and developer’s return. The residual available for the land is sensitive to each assumption. Read Land Value With Planning Permission for that separate analysis.
A holding can contain more than one value category. The core farm may remain agricultural, while a road frontage, redundant building, settlement-edge parcel or land required for infrastructure has a different market. Parcel-by-parcel analysis is often more reliable than applying one rate to the entire title.
Do not apply a development-land rate merely because agricultural land is close to housing. Planning prospects, access and net developable capacity must first be established.
Tax and succession require current advice
Tax rules can affect ownership decisions, but they do not turn a historic price table into a tax valuation.
From 6 April 2026, the combined value of qualifying agricultural and business property receiving 100% Agricultural Relief or Business Relief is subject to a £2.5 million allowance, with qualifying value above the available allowance generally receiving 50% relief. Unused allowance may be transferable between spouses or civil partners, subject to the rules and claims applying to the estate.
The tax treatment depends on ownership, occupation, the nature of the business, lifetime gifts, trusts, residential elements and other facts. Development promotion, option arrangements, cessation of farming or changes in occupation may have consequences that require specialist tax and legal advice before terms are signed.
A valuation for inheritance tax, capital gains, accounts, lending, matrimonial proceedings or another formal purpose may require a specific statutory basis and valuation date. The market evidence should be selected and adjusted for that purpose by an appropriately qualified professional.
Good information makes it easier to distinguish agricultural evidence from residential, equipped and development value.
Confirm titles, acreage, rights, woodland, buildings, dwellings, entitlements and any property excluded or retained.
Provide farm business tenancies, agricultural holdings tenancies, licences, grazing arrangements and notices affecting vacant possession.
Include soil and grade information, cropping history, drainage, access, water, environmental schemes and known defects or capital requirements.
Identify planning uses, occupancy restrictions, condition, income and repair requirements so they are not hidden within an acreage rate.
Compare genuinely similar holdings and adjust for date, quality, scale, possession, buildings and special purchaser circumstances.
Check policy, settlement relationship, planning history and technical constraints before attributing hope value. Our agricultural development-potential guide outlines the planning review.
A free initial planning and value-context review
Send us the land location and approximate acreage. We can review whether the broad agricultural benchmark appears to be the whole picture or whether planning, buildings, access or strategic location warrant separate advice.
Request Your Free Farmland ReviewHow Value My Land can assist
We help landowners understand the planning context before they rely on a headline agricultural figure or accept development terms.
Our free initial review considers the land location, settlement relationship, planning designations, nearby development, apparent access and broad technical context. We can identify whether the holding appears to be solely an agricultural asset or whether a defined parcel should be investigated for longer-term development potential.
We do not replace a formal agricultural valuation, legal title review, tax opinion or professional survey. Where those are required, the landowner should instruct appropriately qualified advisers. Our role is to help frame the planning and commercial questions and avoid treating every acre as though it has the same use, risk and market.
Where a credible opportunity exists, we can discuss planning promotion and the evidence likely to be needed. Where the opportunity is weak, an early review can also help prevent unnecessary expenditure or unrealistic expectations based on isolated high-value sales.
August 2026 National Policy
Regional price evidence describes transactions and market conditions during a stated period. The August 2026 NPPF may affect an alternative-use scenario, but it does not retrospectively convert agricultural survey figures into development-land values.
The 2024–2025 figures should be read as market context for that period. Later movements in interest rates, commodity conditions, supply or buyer demand may mean a current transaction requires newer local evidence.
A regional range cannot account for soil quality, lot size, buildings, access, tenure, location or local competition. Individual comparable transactions should be adjusted before they are applied to a particular holding.
The price of productive farmland should be supported by comparable farming transactions. A possible housing or commercial use belongs in a separate hope-value or development-value scenario.
Completed-development revenue, residual land value and agricultural sale price measure different things. Planning policy can affect the residual assumptions, but it does not make headline house values a valid farmland comparison.
Use the regional figures to understand the agricultural market and then test the individual land against local transactions. Any planning-led premium arising under the August 2026 NPPF should be identified separately, with its probability, timing and costs made explicit.
Read the National Planning Policy Framework published on 17 August 2026.
These guides separate ordinary agricultural market evidence from hope value, development potential, farm-wide value and the commercial decision to sell or wait.
Understand the principal physical, occupational and market factors used when valuing farmland.
Read the guideRead the broader guide to comparable, residual, existing-use, hope and development valuation methods.
Read the guideLearn why agricultural value and value based on a credible future development use should be kept separate.
Read the guideSee how the market may reflect a prospect of future planning progress before allocation or permission.
Read the guideUnderstand the planning and location factors that may justify assessing farmland for a different future use.
Read the guideReview circumstances in which parts of a farm may have value beyond ordinary agricultural use.
Read the guideExplore the distinction between agricultural use, Green Belt designation and planning potential.
Read the guideCompare present certainty with the potential value, delay and risk associated with future planning progress.
Read the guideConsider the complete holding, including land, buildings, occupation, residential elements and development prospects.
Read the guideThere was no single definitive UK average. Published surveys used different geographies, land classes and methodologies. Knight Frank’s opinion-based bare-land index recorded £9,164 per acre for England and Wales at Q4 2024 and £8,696 at Q4 2025. Strutt & Parker’s exchanged-sale series reported £11,100 per acre for English arable land and £9,000 for pasture in 2024, while its first-nine-months 2025 update reported £10,400 and £8,500. These figures answer different questions and should not be combined without understanding the evidence base.
Some indices are opinion-based, some use completed or exchanged transactions, some exclude houses and buildings, and some report only holdings above a particular acreage. Prime arable land, poorer pasture, equipped farms, small amenity parcels and tenanted land also behave differently. Regional averages can therefore be useful context but are not interchangeable valuation evidence.
No. This page records evidence reported for 2024 and 2025. It is intentionally dated and should be treated as a historical benchmark. A current valuation requires recent local comparable evidence, inspection and consideration of the land’s condition, occupation, buildings, rights, liabilities and market at the valuation date.
Not necessarily. Small paddocks or amenity parcels can achieve a higher price per acre because the total purchase price is accessible to a wider buyer pool. Larger commercial blocks are more likely to be assessed by productive capacity, location and farm-business demand. A high small-lot rate should not automatically be applied to hundreds of acres.
Vacant possession often gives a purchaser immediate control and can widen the buyer market. A tenancy, grazing licence, occupation arrangement or delayed completion may reduce flexibility or alter the capitalisation of income. The legal status and termination provisions must be checked rather than assuming that physical occupation can be ended easily.
Yes. Soil type, Agricultural Land Classification, drainage, field size, topography, climate, water availability and cropping history can affect productive use and buyer demand. However, exceptionally strong local competition, amenity interest or development prospects can sometimes outweigh a purely agricultural quality comparison.
Whole-farm transactions often include a farmhouse, cottages and buildings, while bare-land indices may exclude them. Their contribution should be assessed separately because residential condition, planning use, occupancy restrictions, diversification potential and repair liabilities can materially change the total holding value.
Development potential should normally be assessed as a separate layer rather than built into a regional agricultural average. Location, planning policy, settlement relationship, access and technical constraints determine whether hope value is justified. Read our existing-use versus development-value guide before applying development assumptions.
No. Tax reliefs and succession objectives may influence seller and buyer behaviour, but market value and tax treatment are separate questions. From 6 April 2026, the rules for Agricultural Relief and Business Relief changed, so owners should obtain current specialist tax advice based on their ownership and estate rather than relying on historic commentary.
Our free review is not a formal Red Book valuation. We can consider the broad agricultural context and whether planning or development matters warrant further investigation. Where a formal valuation is required for tax, lending, accounts, litigation or a regulated purpose, an appropriately qualified valuer should be instructed.
Send us the location and approximate size of the land. We will undertake a free initial review of the planning context and consider whether ordinary agricultural evidence is likely to tell the whole story.
The review is not a formal valuation or tax opinion, but it can help identify the parcels and issues that should be investigated before a sale, succession decision or development agreement.
Understand whether broad agricultural evidence is likely to reflect the whole holding or whether particular land may require a separate planning and development assessment.
We can review the location and broad planning context before you commission a formal valuation or enter development terms.
Phone
0800 061 4006Office
13 Ensign Business Centre
Westwood Way
Coventry
CV4 8JA